How Databases Actually Work: What Happens When You Run a Query
Introduction
Every day you write code that saves user profiles, records orders, and fetches messages. You type a bit of SQL, hit execute, and the data appears. But you are probably treating one of the most sophisticated pieces of engineering in your stack as a complete black box.
That black box has a name, a structure, and entirely predictable behavior. Once you understand what actually happens between your query and your result, you stop writing accidentally slow code and you start writing intentionally fast code.
Here is what we will cover: the anatomy of a database engine, how B-tree indexes actually work, what the query planner does before touching your data, how transactions protect you from corruption, and why a single write is more expensive than you think.
Part 1: Anatomy of a Database Engine
Imagine a massive public library. There are physical bookshelves holding millions of books, a reading desk where people actively study, and a head librarian coordinating everything. Your database works exactly like this.
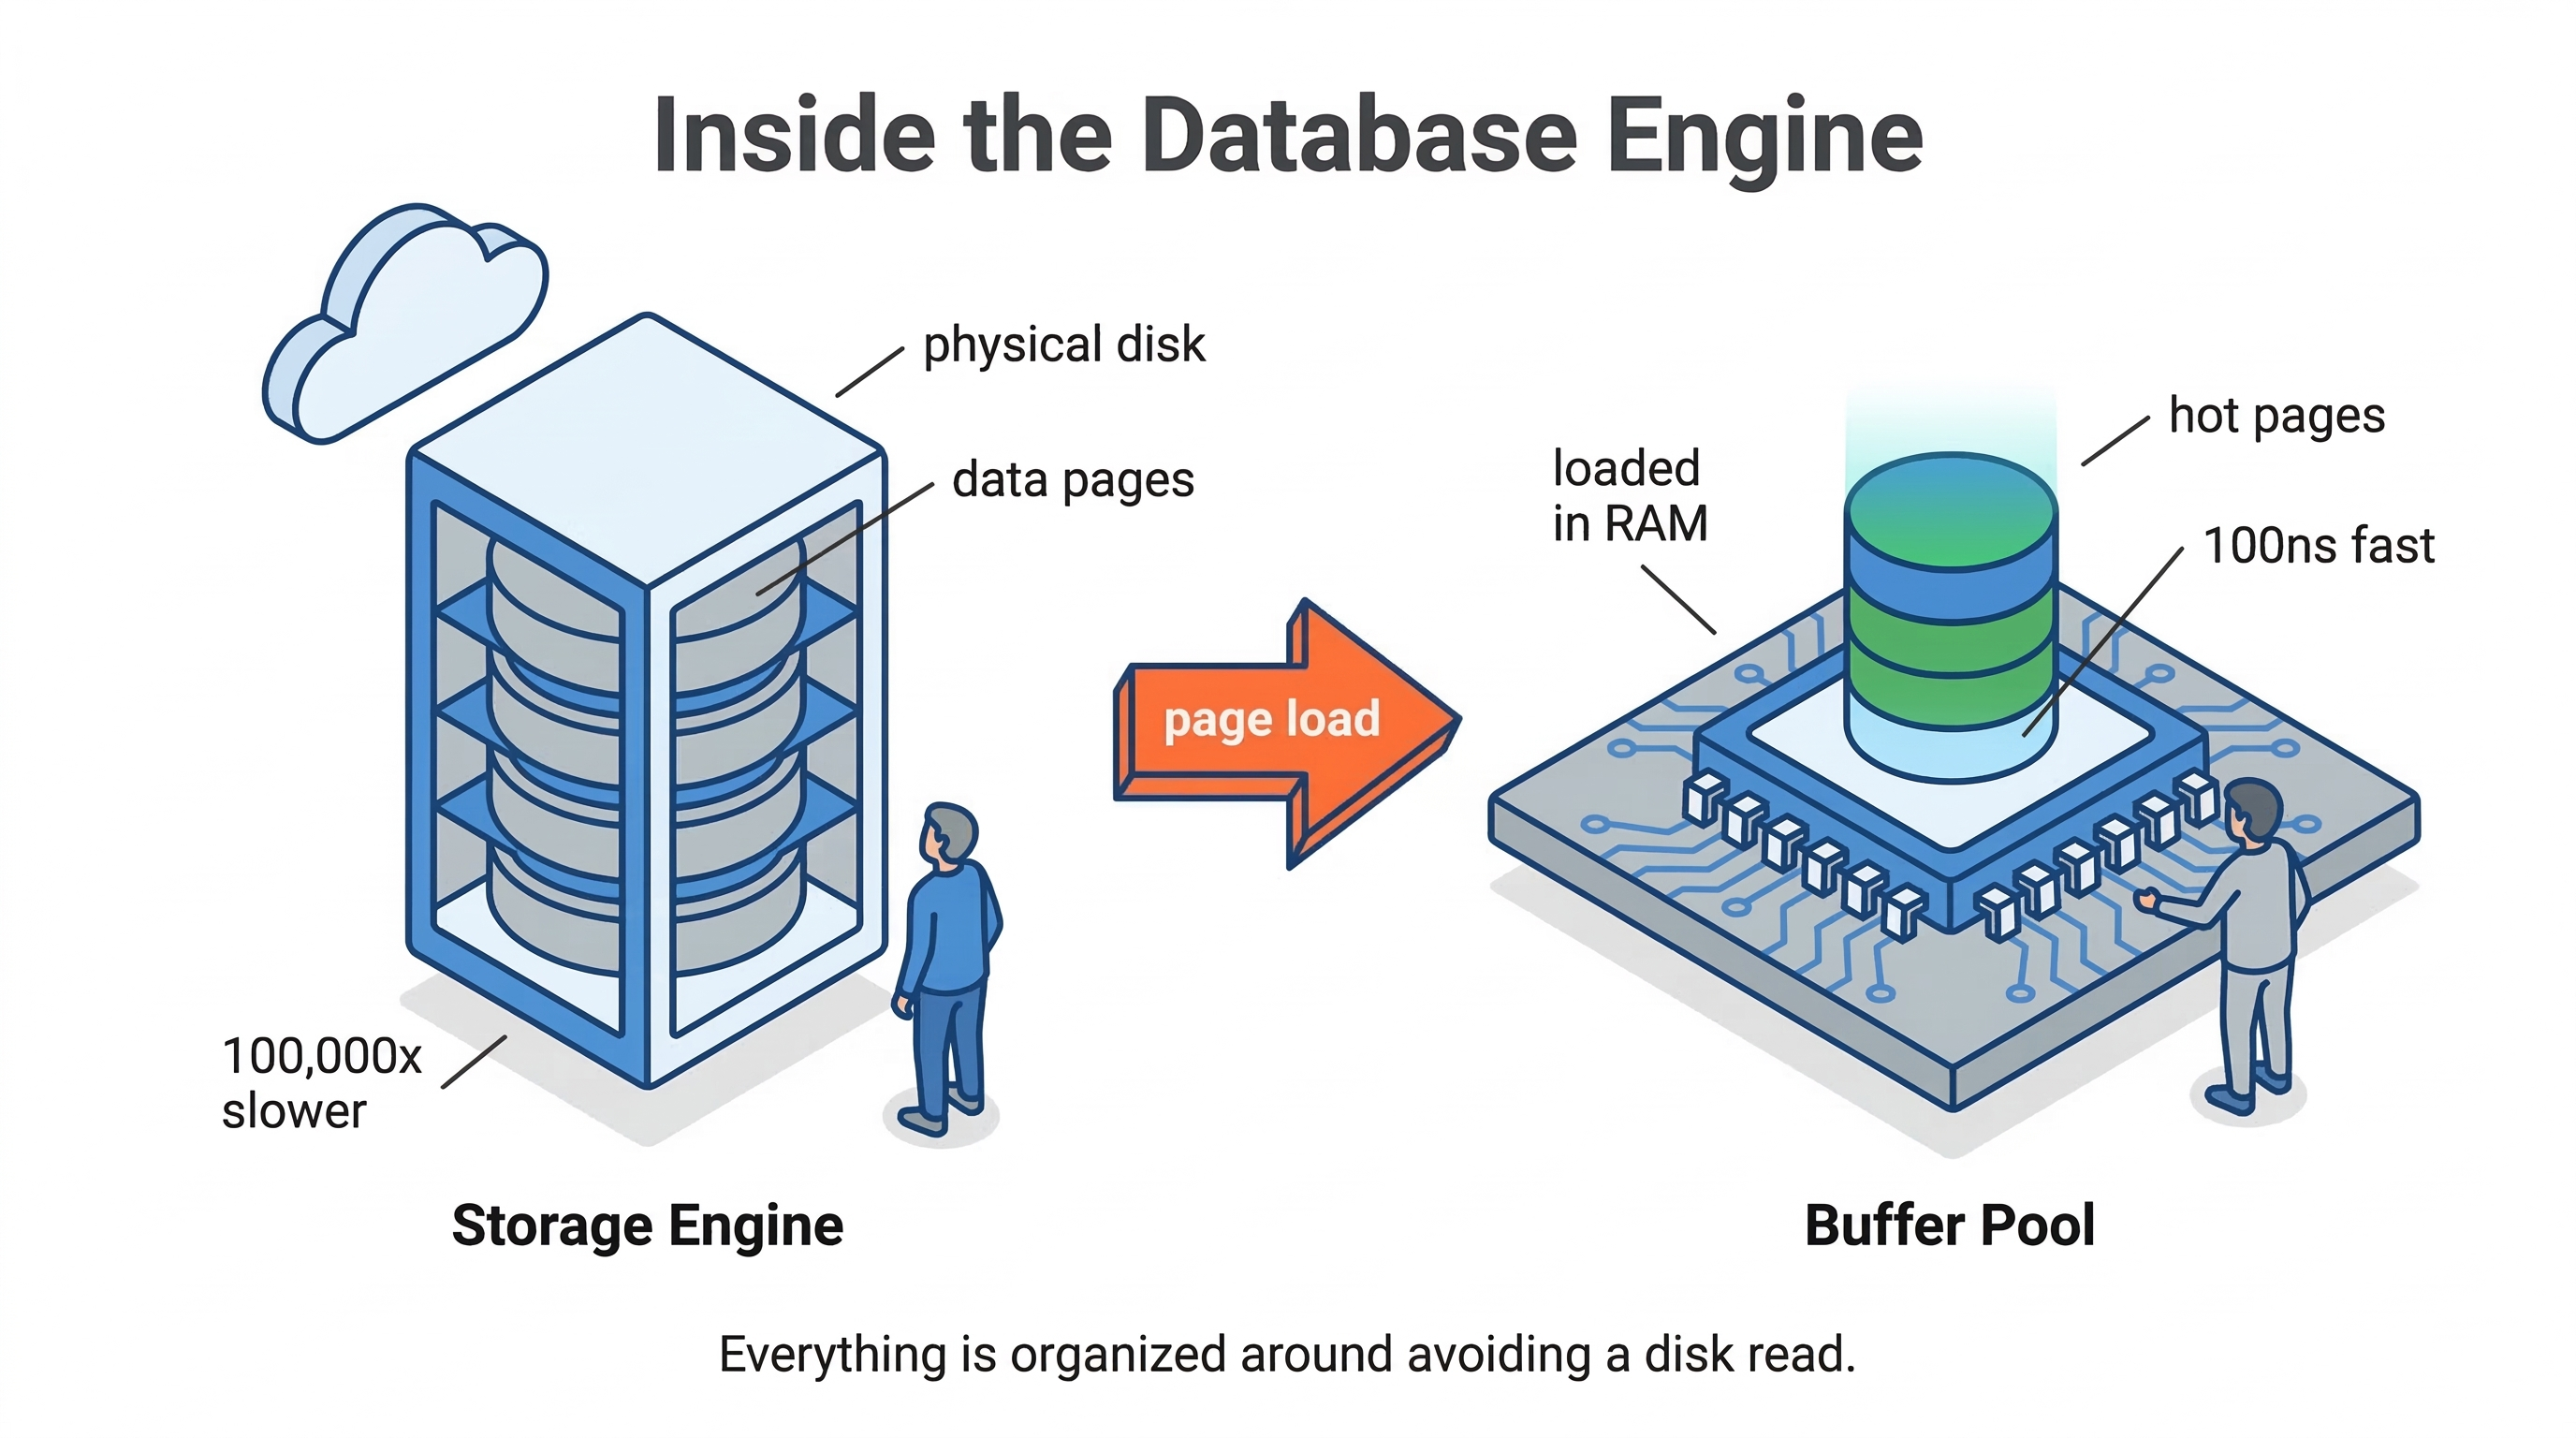
The physical shelves are the storage engine organizing your actual data on disk. The reading desk is the buffer pool — keeping frequently accessed data in blazing-fast RAM. The head librarian is the execution engine — the coordinator that fetches your data safely and efficiently.
Every database splits its core work into two parts. The query engine figures out what data you want. The storage engine figures out how to physically retrieve it. When you ask for data, the execution engine always checks the buffer pool first. If it is a cache miss, it loads a page of data from disk into memory.
This distinction matters enormously. Reading from RAM takes around 100 nanoseconds. Reading from a spinning hard drive takes around 10 milliseconds. That makes a disk read roughly 100,000 times slower than a memory read. Everything your database does is organized around avoiding that penalty.
 Click to expand
Part 2: How Indexes Actually Work
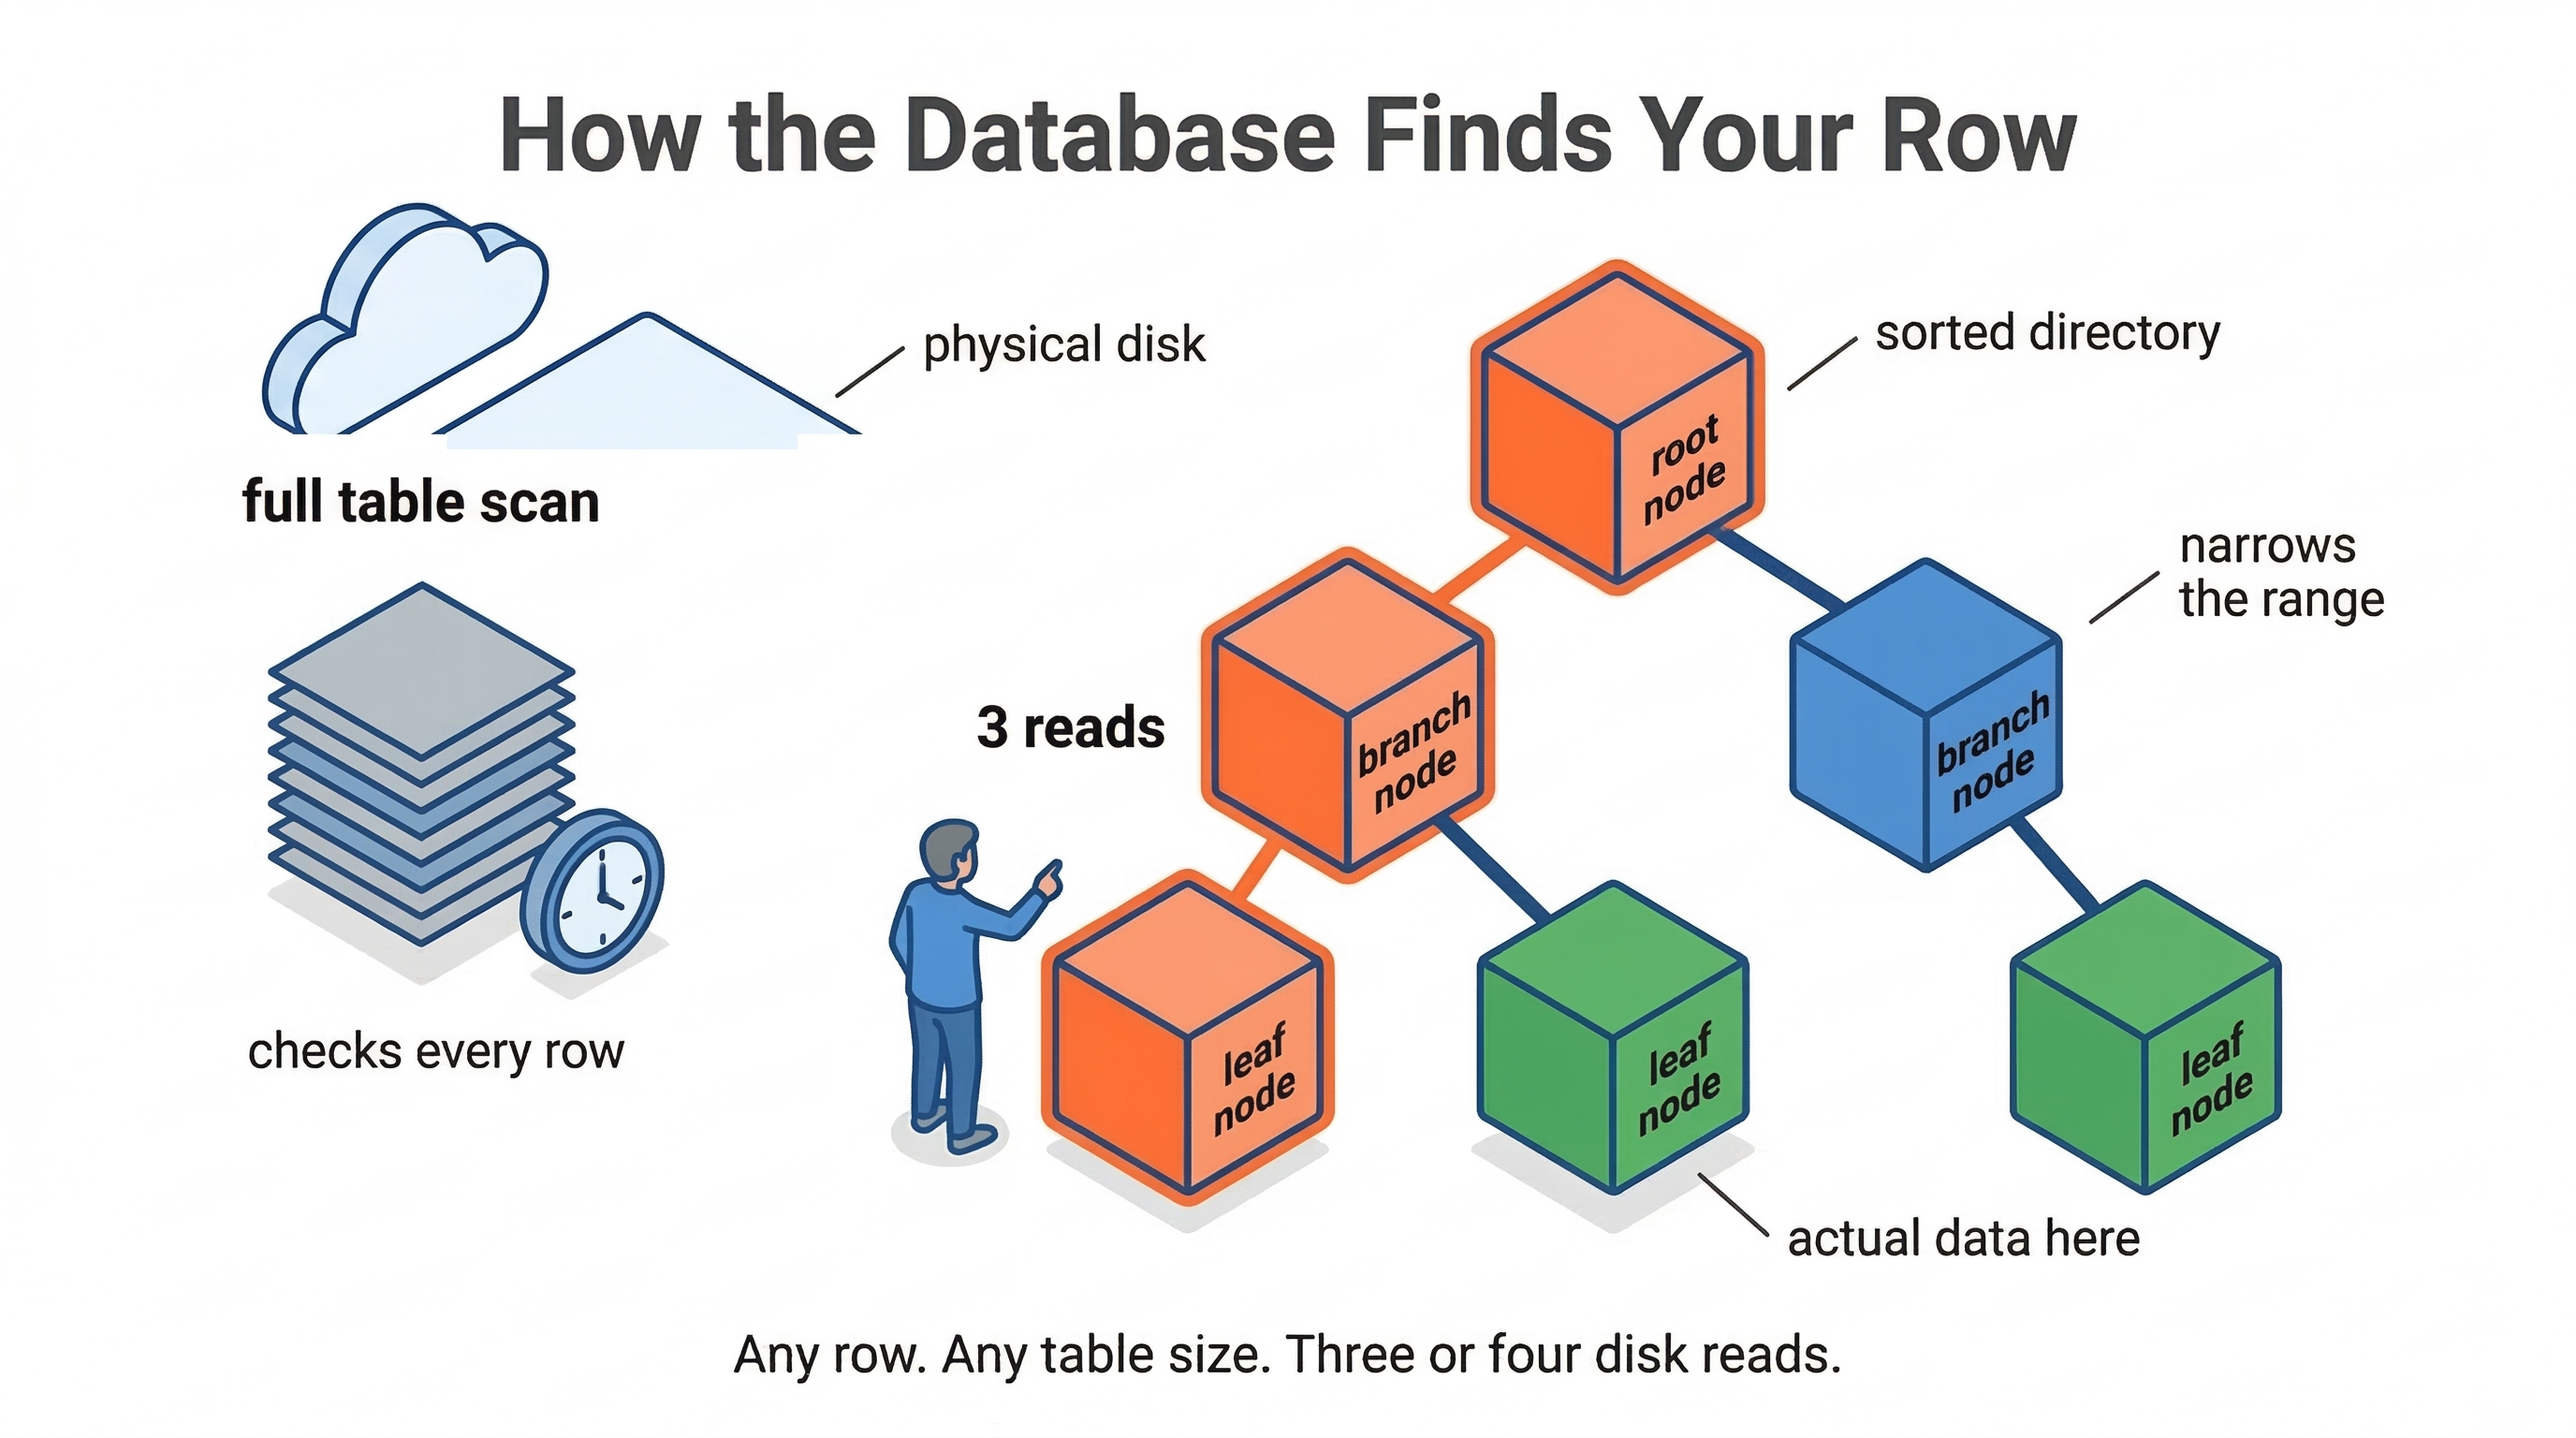
Imagine searching that massive library for one specific book by checking every single cover. That is a full table scan — and scanning millions of unordered rows is brutally slow.
To solve this, databases use a B-tree. Think of it as a perfectly organized filing cabinet. At the top is a root node that acts like a directory, pointing you toward child nodes based on alphabetical or numerical ranges. You follow pointers down each level, narrowing your search until you hit a leaf node containing the actual data. Because the tree stays balanced, finding any single record requires just three or four disk reads regardless of table size.
Index order matters more than most developers realize. A composite index on (last_name, first_name) sorts data strictly left to right. This is the leftmost prefix rule — if your query only filters by first_name, the index is entirely skipped because you bypassed the primary sort key.
⚠️ Common Mistake: Over-indexing your tables. Indexes speed up reads but they punish writes. Every insert has to find the right position in the sorted tree, which can trigger node splits and rebalancing — potentially dozens of disk operations for one row.
When disk pages fill up, random inserts cause heavy fragmentation, leaving wasted space inside index nodes. This is index bloat, and it quietly kills query performance over time even when your indexes look correct.
 Click to expand
Part 3: The Query Planner — Your Database's Brain
Your SQL query is just a string. Before a single byte of data moves, the database has to figure out what you actually want and how to get it efficiently.
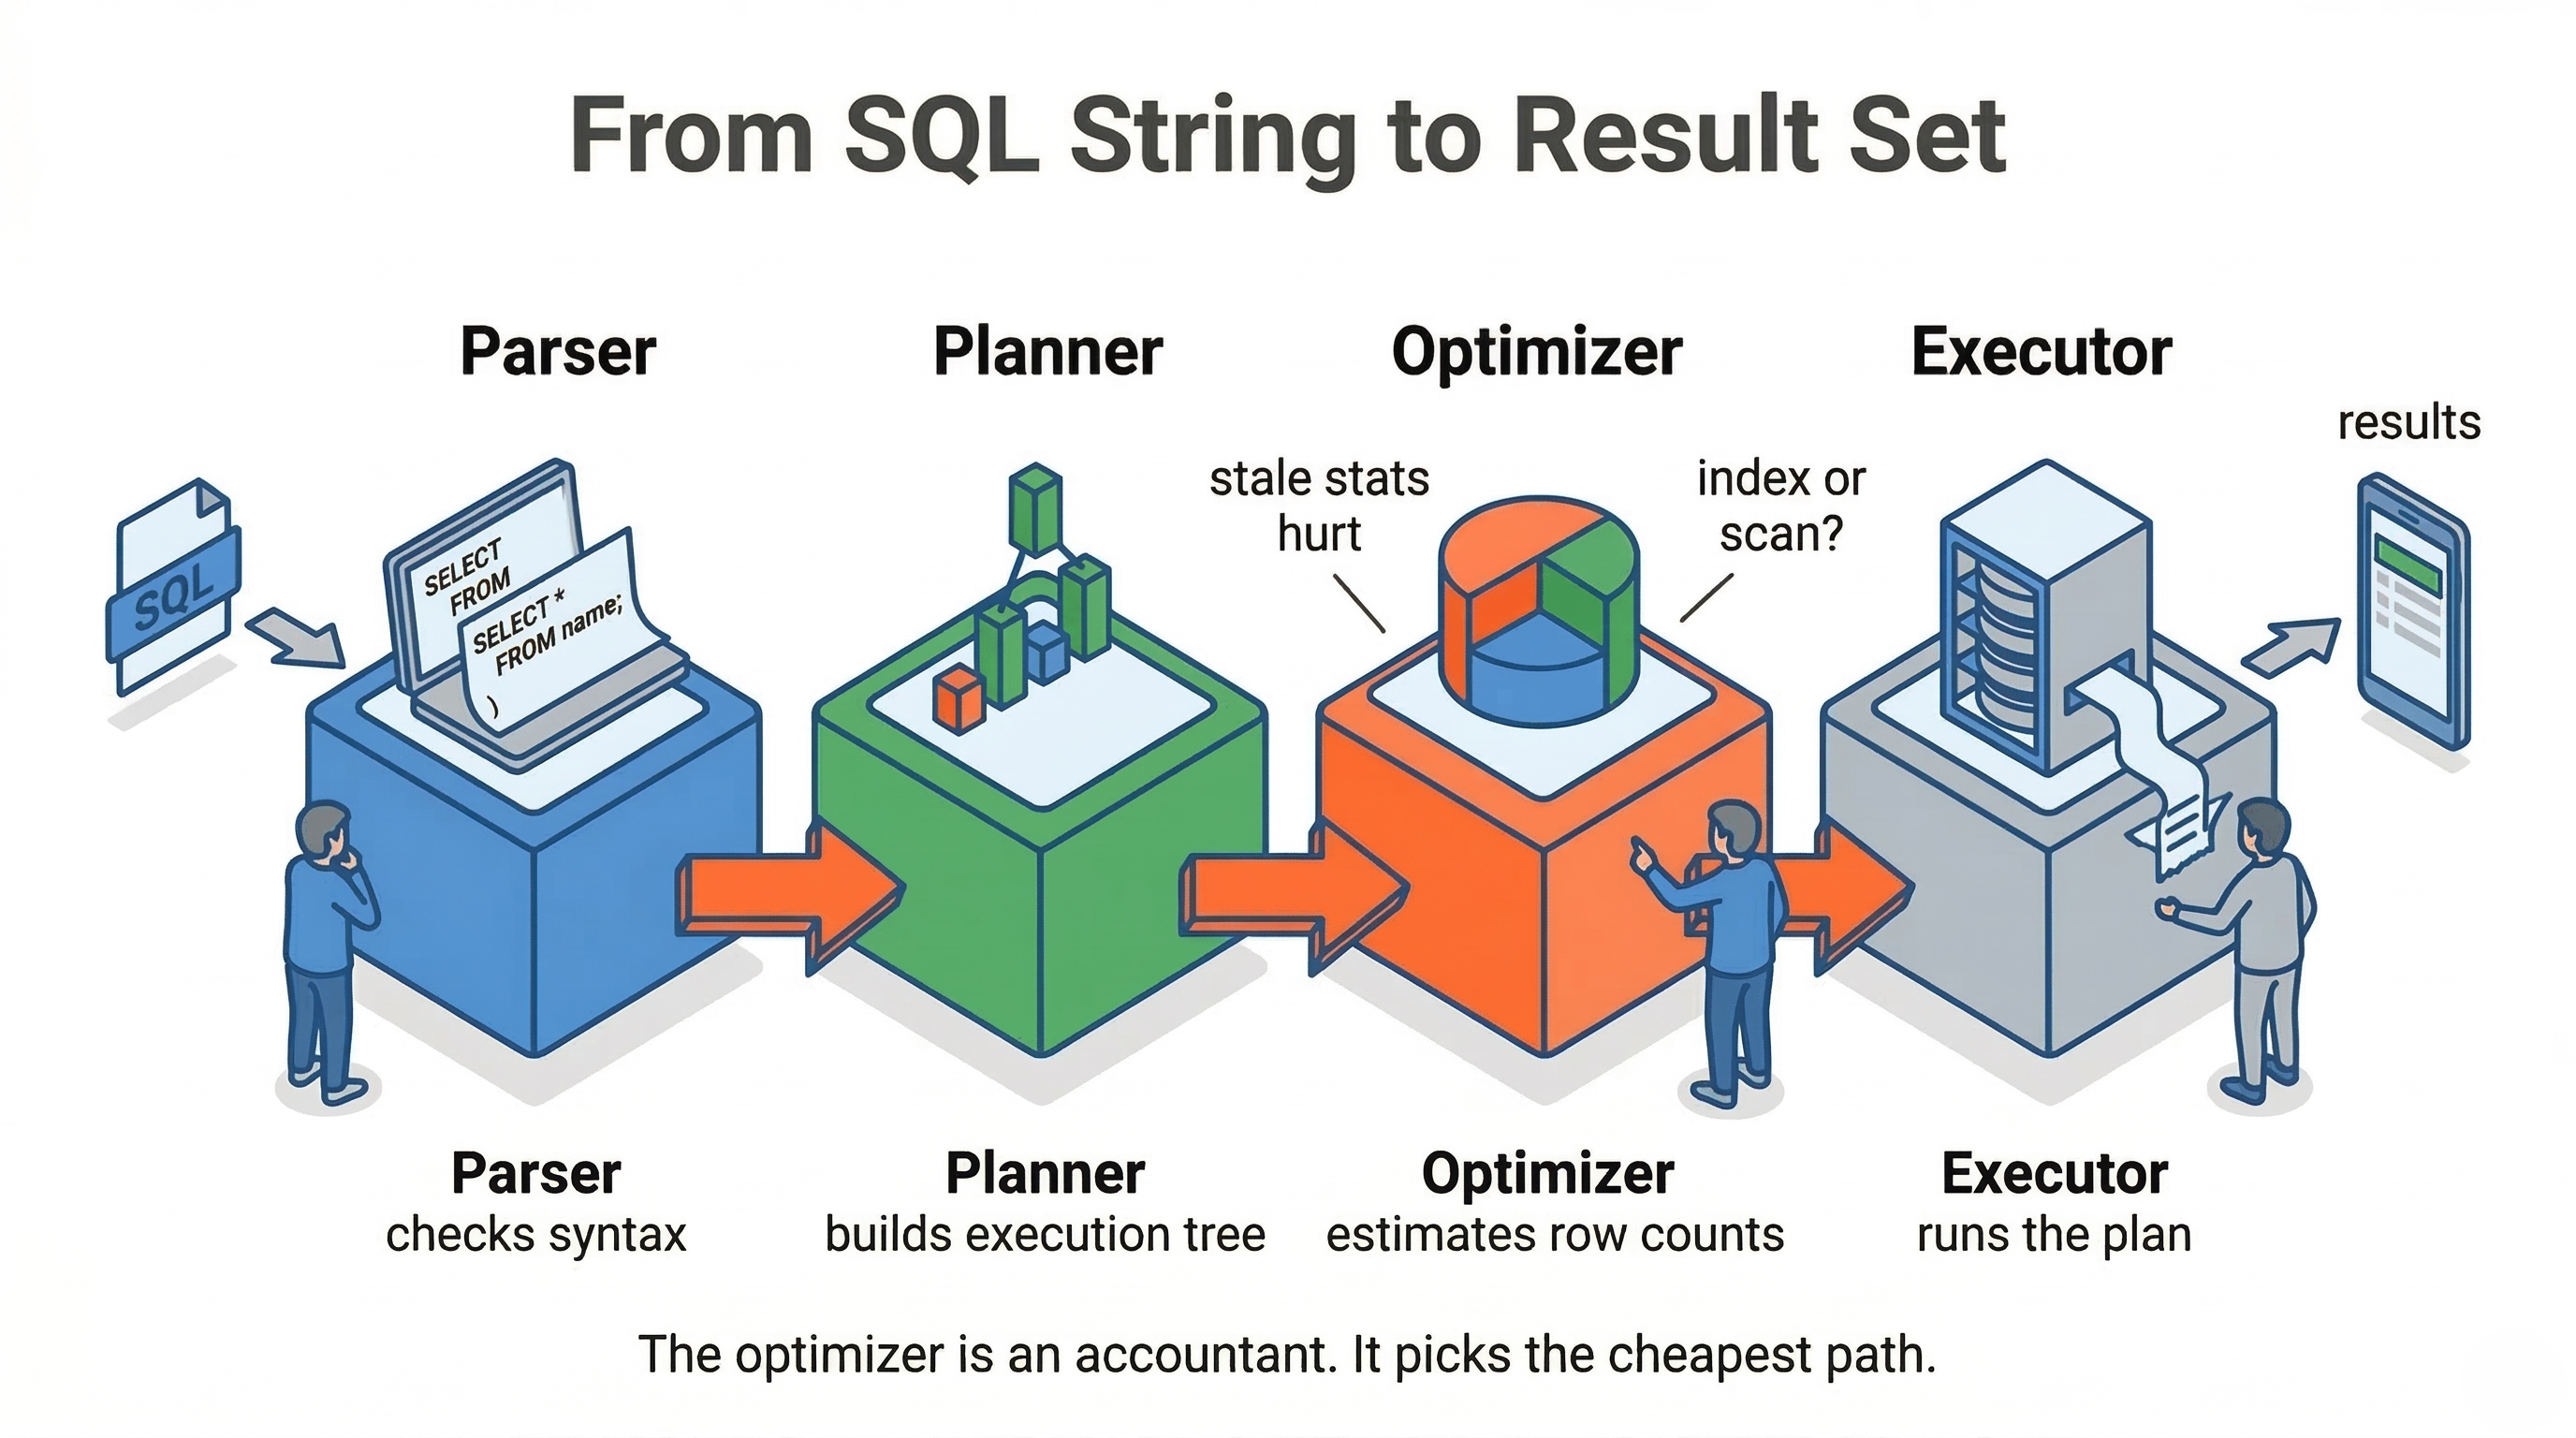
First, a parser breaks your raw string into tokens, checks your syntax, and converts it into an Abstract Syntax Tree. That tree is handed directly to the optimizer.
The optimizer acts like a stingy corporate accountant. It evaluates every possible execution path and picks the cheapest one. It estimates row counts, decides whether a B-tree index is worth using, and sometimes determines that a full table scan is actually faster than an index lookup for large result sets.
You can read the optimizer's mind directly:
EXPLAIN ANALYZE
SELECT * FROM users WHERE status = 'active';
The output shows you exactly which execution path was chosen, what the estimated row count was, and how long each step actually took. The gap between estimated rows and actual rows is your biggest clue — when those numbers diverge dramatically, the optimizer is working from stale statistics and making poor decisions.
✅ Best Practice: Run
EXPLAIN ANALYZEon your slowest queries. Look for sequential scans on large tables and rows estimates that are wildly off from actuals.
 Click to expand
Part 4: Transactions and ACID
A transaction guarantees that a batch of database operations either completes entirely or fails entirely. No half-saved states. No corrupted records. This is managed by the transaction manager.
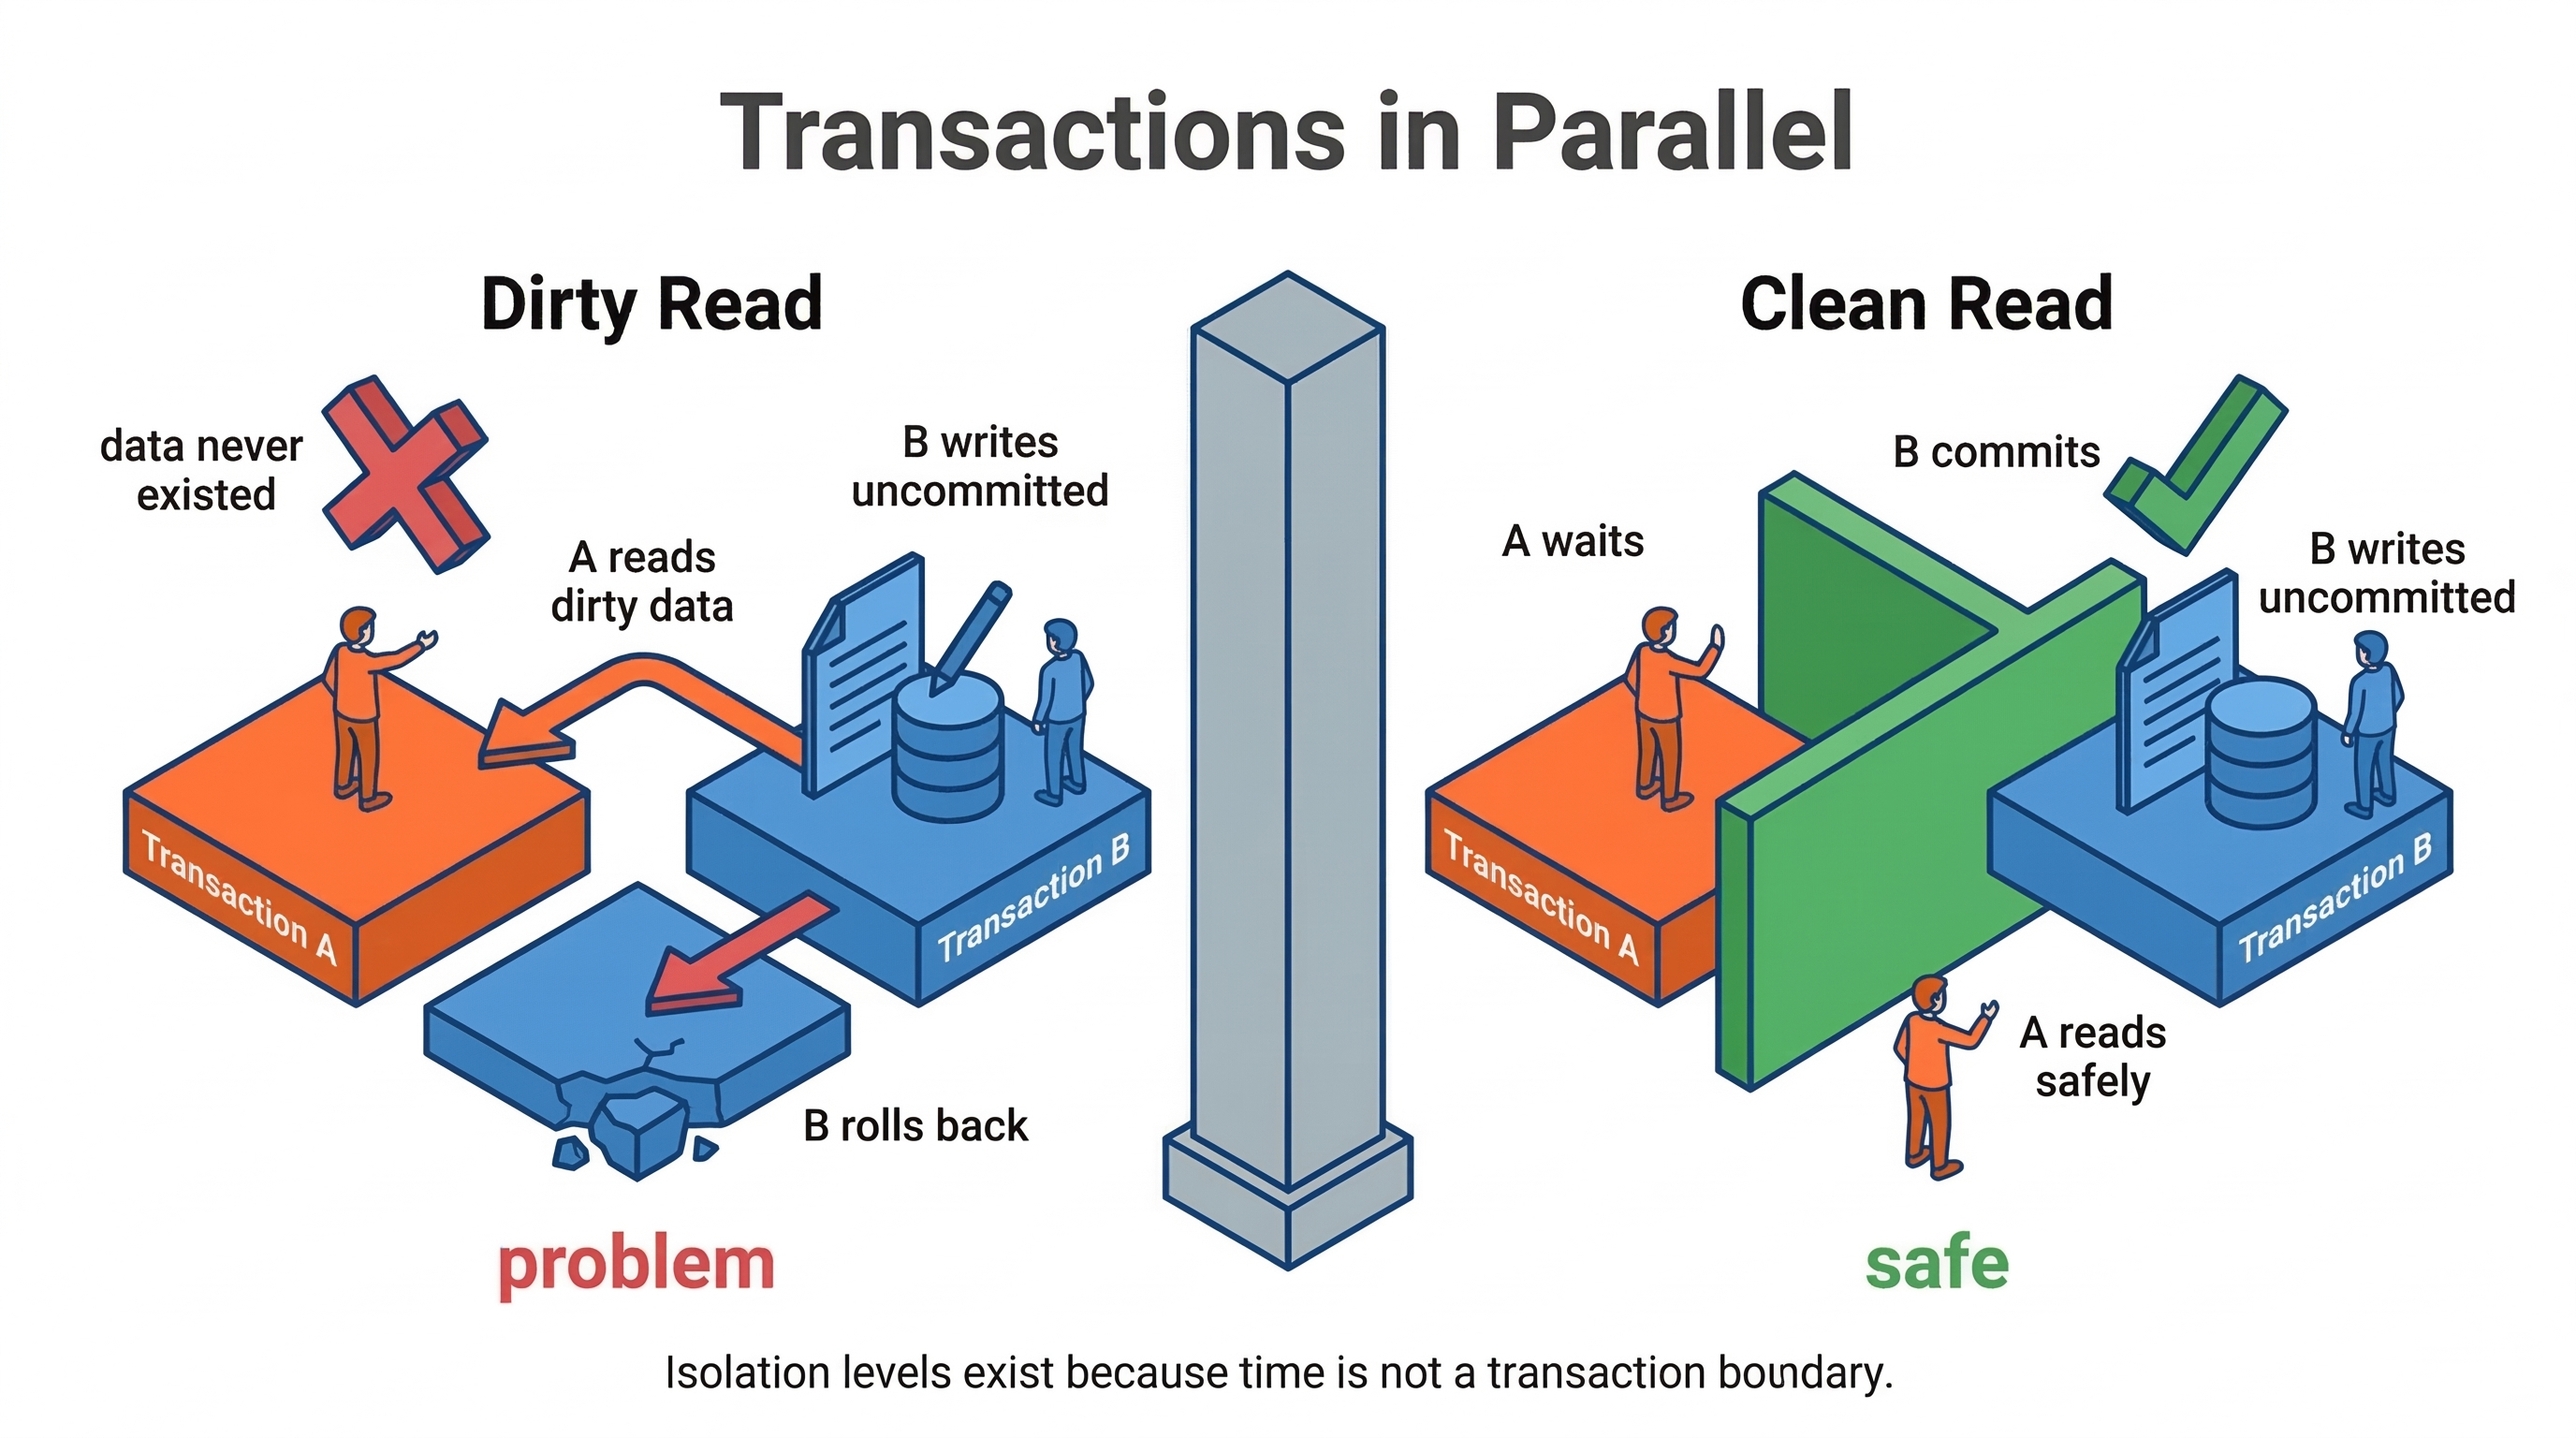
Because databases handle thousands of concurrent connections, a lock manager controls access at the disk sector level. Writes get exclusive locks. Reads get shared locks — multiple queries can read the same data simultaneously without blocking each other.
To make rollbacks possible, the database's recovery manager maintains an undo log — an append-only structure that tracks every change made during an active transaction. If a transaction fails halfway through, the database rewinds every operation in the log back to the clean starting state.
Depending on your isolation level, concurrent queries can behave in surprising ways:
- Dirty read — your query sees uncommitted data from an ongoing transaction that later fails. You acted on data that never officially existed.
- Phantom read — new rows appear in your result set mid-transaction because another user inserted them while you were running.
- Repeatable read — prevents both of the above, but forces the lock manager to work harder, which costs performance.
⚠️ Common Mistake: Wrapping everything in a transaction assuming it is free. Transactions hold locks. Long-running transactions block other queries and can bring a busy system to a halt.
 Click to expand
Part 5: Writes Are Expensive
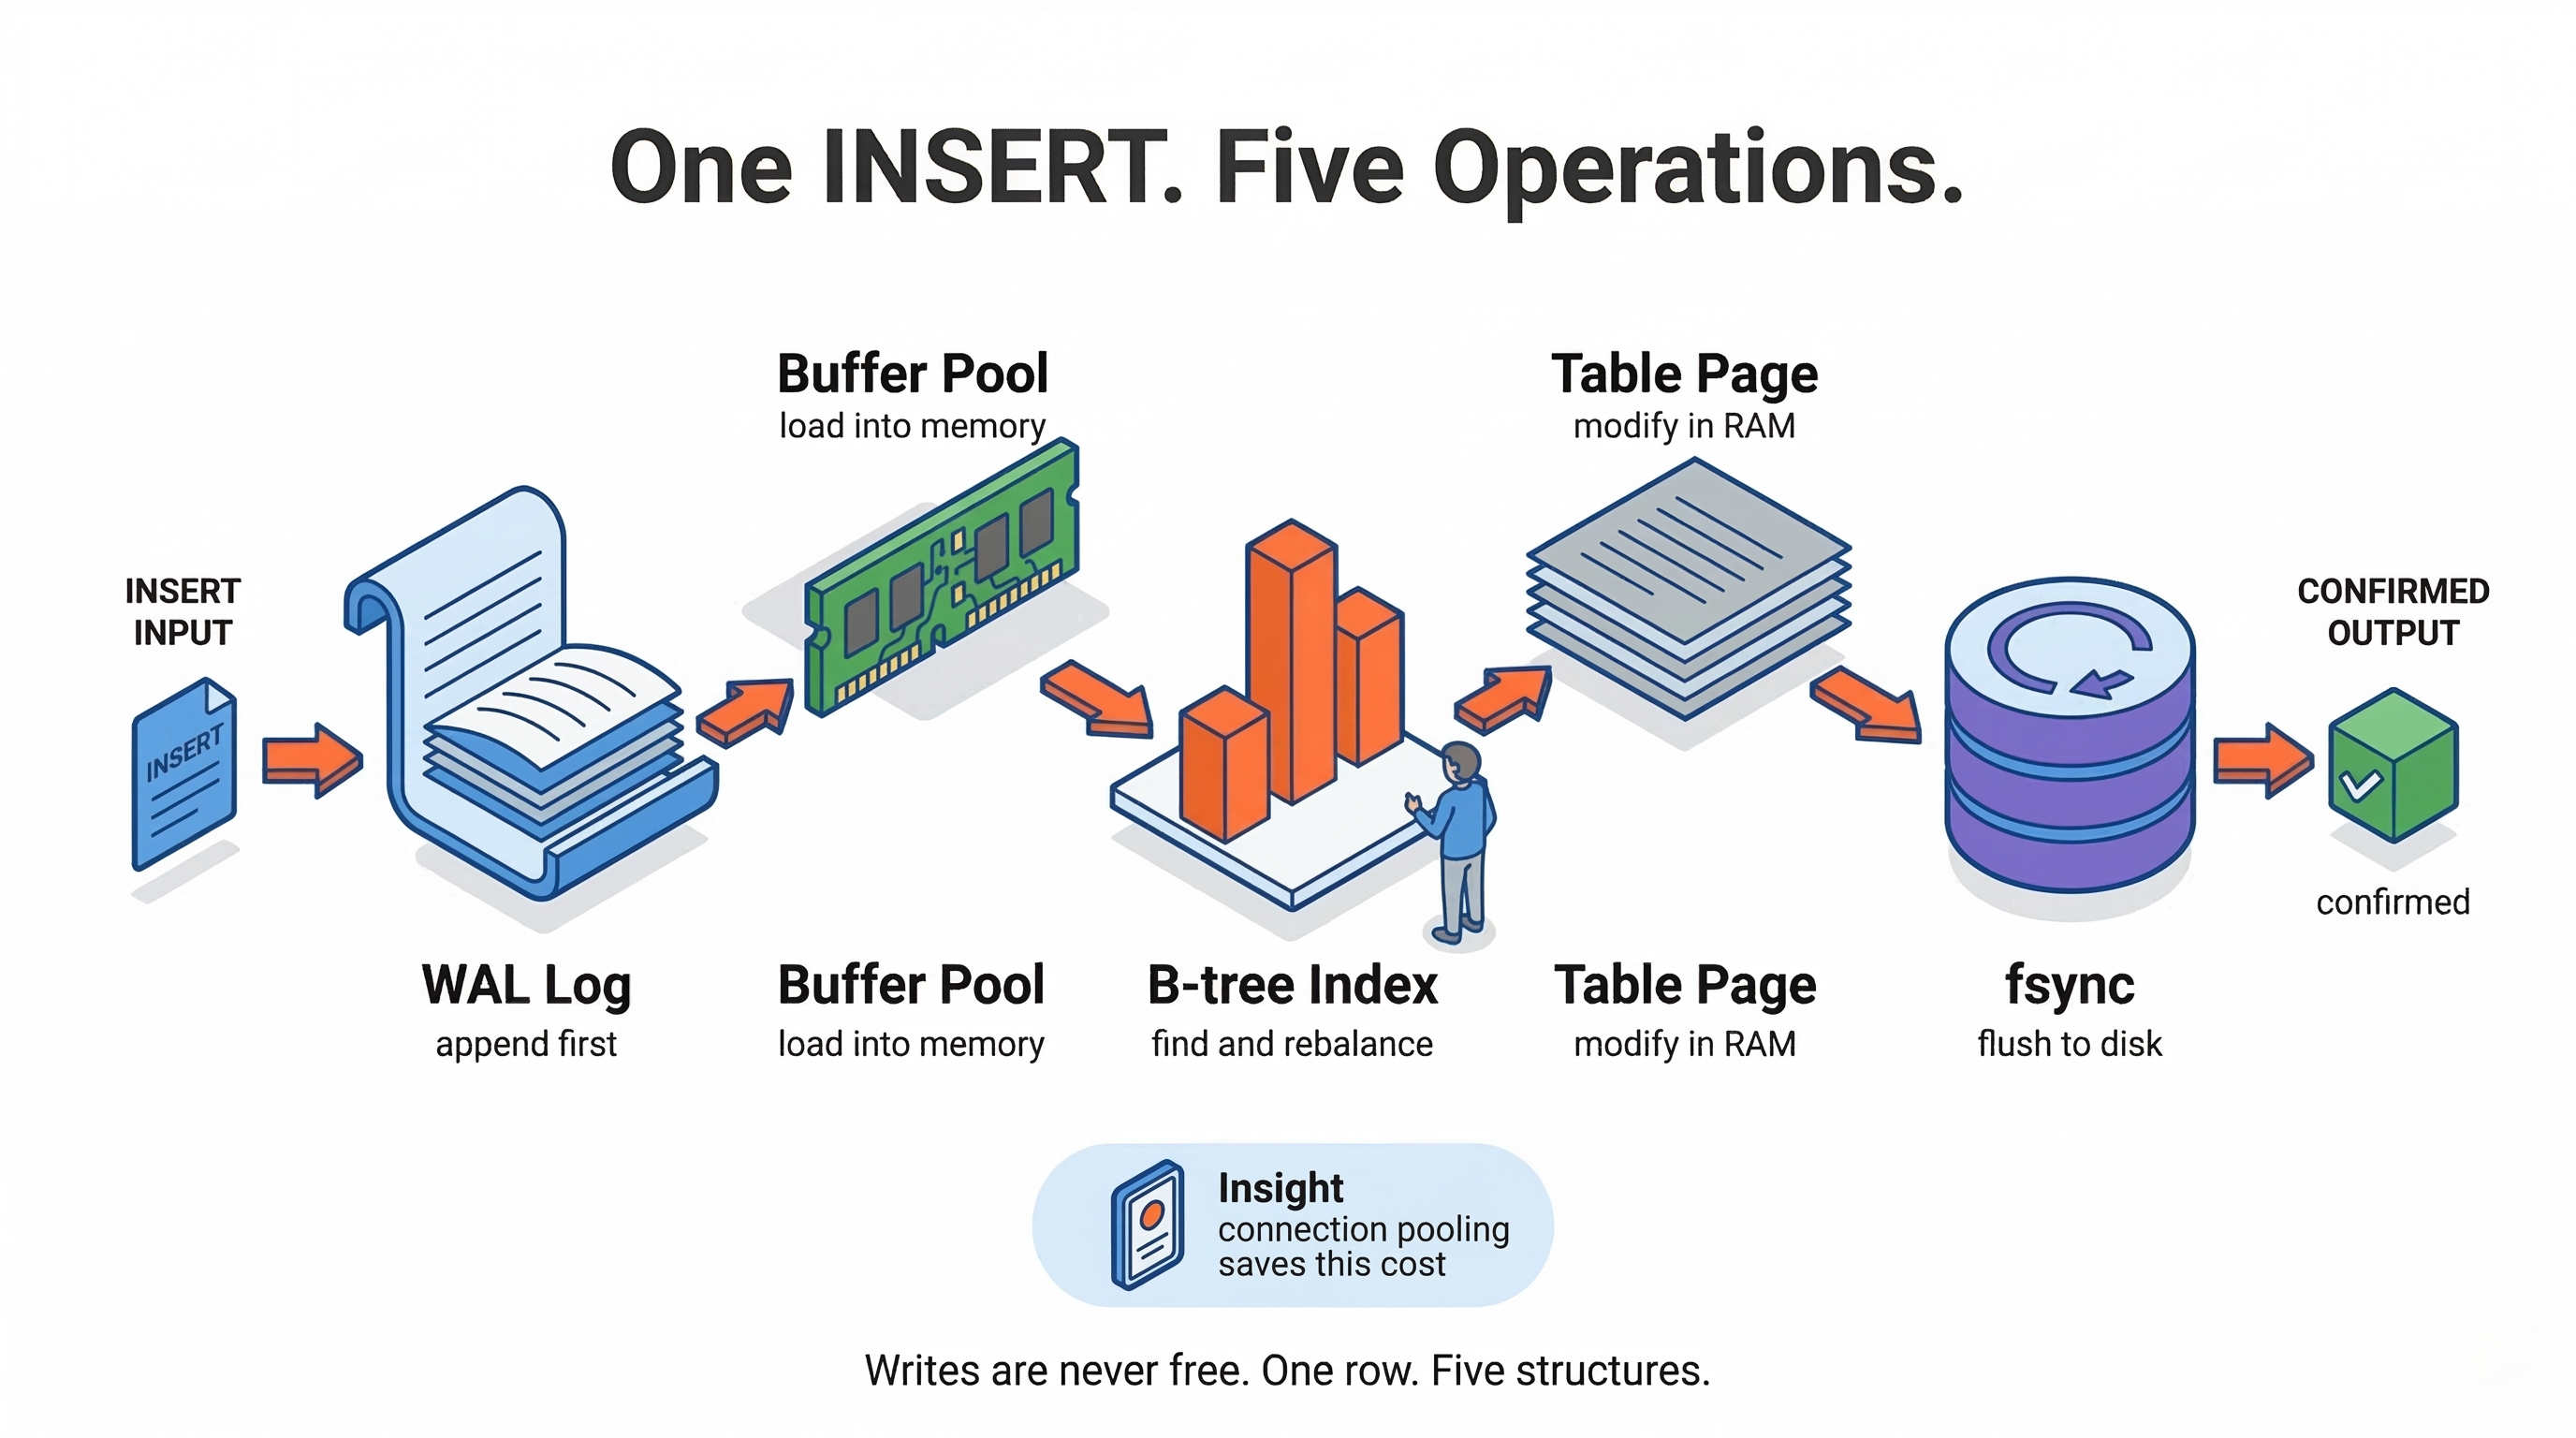
Disks are slow at random access but fast at sequential access. Modern databases exploit this with a Write-Ahead Log (WAL). When you write data, it is first appended sequentially to the WAL before the actual tables are touched. Sequential writes are fast — so the database can confirm your write immediately while the actual page update happens asynchronously.
Here is what actually happens when you run a single insert:
INSERT INTO users (name, email)
VALUES ('Jane Doe', 'jane@example.com');
That one line triggers five separate operations:
- Append to the WAL
- Load the relevant table page into the buffer pool
- Update the B-tree index
- Modify the table page in memory
- Call
fsyncto flush everything permanently to disk
Five disk-touching operations for one row. Now imagine doing that ten thousand times a second under production load.
This is why connection pooling is not optional in production. Building a new database connection for every query adds network handshake overhead on top of these write costs. Reusing established connections eliminates that tax entirely.
✅ Best Practice: Always use a connection pooler — PgBouncer for PostgreSQL, ProxySQL for MySQL. Never open raw connections per request.
 Click to expand
Part 6: What Senior Engineers Know That Juniors Don't
The database is only as good as the instructions you feed it. Most performance problems are not database bugs — they are application code bugs that the database has no choice but to obey.
The N+1 query problem is the most common performance killer in production applications. You fetch a list of 100 users, then loop through them and run a separate query to fetch each user's orders. That is 101 round trips to the database for data you could have fetched in one join.
-- ❌ N+1 — 101 queries
SELECT * FROM users;
-- then for each user:
SELECT * FROM orders WHERE user_id = ?;

-- ✅ One query
SELECT users.*, orders.*
FROM users
LEFT JOIN orders ON orders.user_id = users.id;
SELECT * is a hidden performance tax. It forces the storage engine to pull every column from disk into the buffer pool — including columns your application never uses. Name your columns explicitly and you immediately reduce memory pressure and I/O.
Index bloat accumulates silently. Heavy write workloads fragment your B-tree indexes over time, leaving dead space inside nodes. Query performance drops gradually and the cause is invisible until you inspect the index internals. Rebuilding indexes periodically on write-heavy tables keeps them tight.
Denormalization is sometimes the right answer. Database normalization avoids duplication but forces expensive runtime joins. When a specific query is critically hot and joins are bottlenecking it, intentionally duplicating a column into a second table to avoid that join is a legitimate architectural choice — not a failure.
Quick Reference Cheat Sheet
Query Anti-Patterns
| Anti-Pattern | Why It Hurts | The Fix |
|---|---|---|
SELECT * | Wastes buffer pool RAM and network I/O | Select only needed columns |
| N+1 Queries | Floods the engine with redundant round trips | Use JOIN or batch fetching |
| Missing Indexes | Forces full table scan on every query | Add B-tree index on lookup columns |
| Over-Indexing | Bloats storage, heavily slows writes | Remove unused or redundant indexes |
| Long Transactions | Holds locks, blocks concurrent queries | Keep transactions short and focused |
Index Decision Checklist
- Is this column used frequently in
WHEREclauses? - Does the query return a small percentage of total rows?
- For composite indexes — does your query filter by the leftmost prefix?
- Is this table read-heavy rather than write-heavy?
- Have you checked if an existing index already covers this query?
Transaction Isolation Levels
| Level | Dirty Reads | Phantom Reads | Performance Cost |
|---|---|---|---|
| Read Uncommitted | ❌ Not prevented | ❌ Not prevented | Lowest |
| Read Committed | ✅ Prevented | ❌ Not prevented | Low |
| Repeatable Read | ✅ Prevented | ✅ Prevented (most DBs) | Medium |
| Serializable | ✅ Prevented | ✅ Prevented | Highest |
EXPLAIN Output Reference
| Field | What It Means |
|---|---|
Node Type | The physical operation — Index Scan, Seq Scan, Hash Join |
Cost | Optimizer's estimated computational expense |
Rows | Estimated row count output by this step |
Actual Time | Real execution time — only visible with ANALYZE |
Loops | How many times this node executed |
Key Takeaways
- The database has two engines — the query engine decides what to fetch, the storage engine decides how to fetch it.
- RAM vs disk is the fundamental tension — everything the database does is organized around keeping hot data in memory.
- B-trees guarantee logarithmic lookups — any row in a billion-row table in three or four disk reads.
- The leftmost prefix rule is not optional — composite index column order directly controls which queries the index can serve.
- The query optimizer works from statistics — stale stats produce bad plans; keep them fresh.
- Transactions hold locks — long-running transactions block concurrent queries and should be kept as short as possible.
- One write touches five structures — WAL, buffer pool, B-tree, table page, fsync. Writes are never free.
- N+1 queries are the silent production killer — always fetch associated data in a single join, never in a loop.
Conclusion
Treating your database as a magical black box is a recipe for production disasters you cannot diagnose. The mindset shift is simple but powerful: databases are not magic. They are predictable, mechanical engines with knowable behavior and strict physical constraints. Once you see the machine, you stop being surprised by it.
Three concrete next steps:
- Run
EXPLAIN ANALYZEon your application's slowest query today. Find the step with the biggest gap between estimated rows and actual rows — that is where your optimizer is flying blind. - Audit your indexes — find tables with heavy write workloads and count their indexes. Every unnecessary index is a write tax you are paying on every insert.
- Search your codebase for
SELECT *— replace every instance with an explicit column list. It takes twenty minutes and immediately reduces memory pressure on every query it touches.
Based on the following engineering breakdowns:_
Continue Reading
The Ultimate Guide to API Design & Architecture: Thinking Like a Senior Engineer
A complete, beginner-to-senior guide covering every API type, security layer, and scaling pattern you need to design robust, production-grade systems.
What Really Happens When You Click a Link
That instantaneous flash between clicking a link and seeing a webpage is actually a marathon — DNS lookups, TCP handshakes, TLS negotiations, and a full rendering pipeline, all in milliseconds.